
This is accomplished using a novel data indexing scheme in the PDPP that links the data's position in realspace to its location on disk using an octree. Using this method, we have visualized all of the stars in Gaia DR3, just over one billion stars. Its custom-built octree render engine allows for the exploration of datasets with billions of particles, ensuring smooth navigation even with massive datasets.
For handling large datasets, Firefly utilizes a progressive rendering scheme that loads data within the camera's field of view. This is achieved through a novel data indexing scheme in the PDPP, linking the data's position in realspace to its location on disk using an octree. This method has been used to visualize all of the stars in Gaia DR3, totaling over one billion stars.
The Gaia DR3 dataset, containing the positions of approximately 1.5 billion stars in the Milky Way, is a massive trove of information that can be challenging to visualize interactively. Firefly, our powerful data visualization tool, can now tackle this problem by employing a progressive rendering scheme based on octrees. In this blog post, we will discuss how Firefly uses octrees to visualize very large datasets and explore the algorithm implemented in the Python Data Processing Pipeline (PDPP) to build the octree.
Octrees for Efficient Visualization
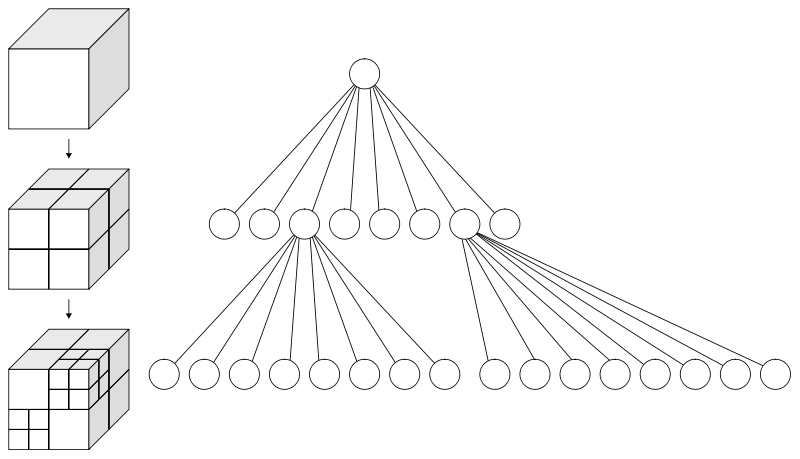
To visualize large datasets without overwhelming the browser's memory, Firefly selectively loads data in proximity to and within the camera's view. This is achieved by pre-formatting the data as an octree using the PDPP and saving the octree files to disk. An octree is a tree data structure that recursively divides 3D space into smaller octants, making it an efficient way to represent spatially partitioned data. Employing an octree significantly improves performance, reduces start-up time, and allows the visualization domain to scale effectively.
While pre-formatting data as an octree can be computationally expensive and requires saving the data to disk, the benefits of visualizing large datasets that would otherwise be inaccessible to interactive visualization techniques outweigh these drawbacks.
Building the Octree Using the PDPP
To create an octree, we typically group particles into nodes containing between 10^4 and 10^5 particles each. The minimum and maximum number of particles per node can be chosen by the user. During tree construction, we also accumulate aggregate statistics, such as total mass and mass-weighted scalar fields. This way, each node in the octree holds aggregate data representing the node on average and buffer data it is responsible for storing.
The algorithm begins by measuring the extent of the 99% of particles closest to the center of the dataset to define the bounding box of the root node. The remaining 1% of particles is held until the octree is constructed and added as buffer data to the root node to minimize the effect of outliers on the tree structure. Particles are then sorted into the eight sub-octants of the root node. Any sub-octant containing more particles than the maximum allowable number per node overflows, and the buffer particles are sorted into the eight sub-octants of that node. The octree is spatially refined as particles are iteratively sorted by recursively applying the maximum-threshold-to-overflow criteria for each of the resulting eight child nodes.
To reduce the number of extraneous nodes with only a few particles, we prune the octree by merging child nodes below the minimum required particles per node back into their parents. This process can result in a node having both buffer particle data and children due to the inherent asymmetry in the dataset's coordinates.
The octree build implementation is optimized for extremely large datasets, can be run in parallel using multiple threads, and does not require loading the entire dataset into memory. The PDPP saves the octree's particle data in binary format and creates a JSON file for Firefly containing the octree structure, accumulated aggregate data for each node, and the locations of the node centers and centers of mass.
Implementing an Octree in Firefly
In the Firefly web application, an octree is represented as a Javascript object defined by the octree JSON file from PDPP. Each node contains pointers to the files on disk, byte sizes, and byte offsets of its buffer data, along with its center of mass, accumulated aggregate data, bounding box, and list of children.
During the render loop, material and geometry mesh objects are dynamically created and filled with buffer data when nodes are opened. The process of updating the octree in the render loop is handled asynchronously to maintain the interactivity of the application. Each octree has its own "draw" and "remove" queues, and the particle data is loaded or purged based on the camera's view and proximity to the nodes.
At each render pass, if the draw queue is not empty and not locked, the node nearest to the camera is selected and the queue is locked. The particle data associated with that node is then loaded from the corresponding binary file and the node is removed from the draw queue. Once the data is loaded, new material and geometry objects are created, and the loaded data is copied into their buffers. The geometry mesh is then added to the scene and the draw queue is unlocked.
The remove queue is emptied at each render pass, disposing of material and geometry objects and freeing up Javascript array data. After updating the draw and remove queues, we walk through the current particle group's octree, deciding whether a node should be opened, closed, or ignored. If a node is on screen and covers more than one pixel from the camera perspective, it is added to the draw queue. If a node has already been drawn but subtends less than one pixel on screen, it is added to the remove queue. Nodes added to either queue are removed from their older opposing queue as necessary.
Through this approach, Firefly can render and interactively explore exceptionally large datasets. For example, we have successfully visualized nearly 1.5 x 10^9 stars from Gaia DR3 in real-time using an octree. As datasets continue to grow, Firefly's octree rendering method will be an invaluable tool for data exploration and public outreach.
Conclusion
The power of octrees has enabled Firefly to efficiently visualize massive datasets such as Gaia DR3. By using a progressive rendering scheme based on octrees, we can dynamically load data depending on the camera's view, significantly improving performance and reducing memory usage. With the implementation of octrees in Firefly, researchers and enthusiasts alike can now interactively explore some of the largest datasets in astronomy, opening up new avenues for discovery and education.